Image Source: Hosting Capacity Maps for EV Charging
Last week, Atlas published a new report on how electric vehicle (EV) charging developers are using hosting capacity maps and how utilities can make them as useful as possible. Supported by the Natural Resources Defense Council (NRDC), the analysis draws on a series of interviews we conducted with EV charging developers that rely on these maps and utilities that create these maps.
Hosting capacity maps are vital tools for both EV charging developers and utilities.
They provide a geographic visualization of existing distribution grid assets, highlighting areas with available electrical capacity and potential constraints. This information enables developers to make informed decisions about where to pursue EV charging projects in a manner that can reduce infrastructure costs, accelerate project timelines, and better utilize existing grid capacity.
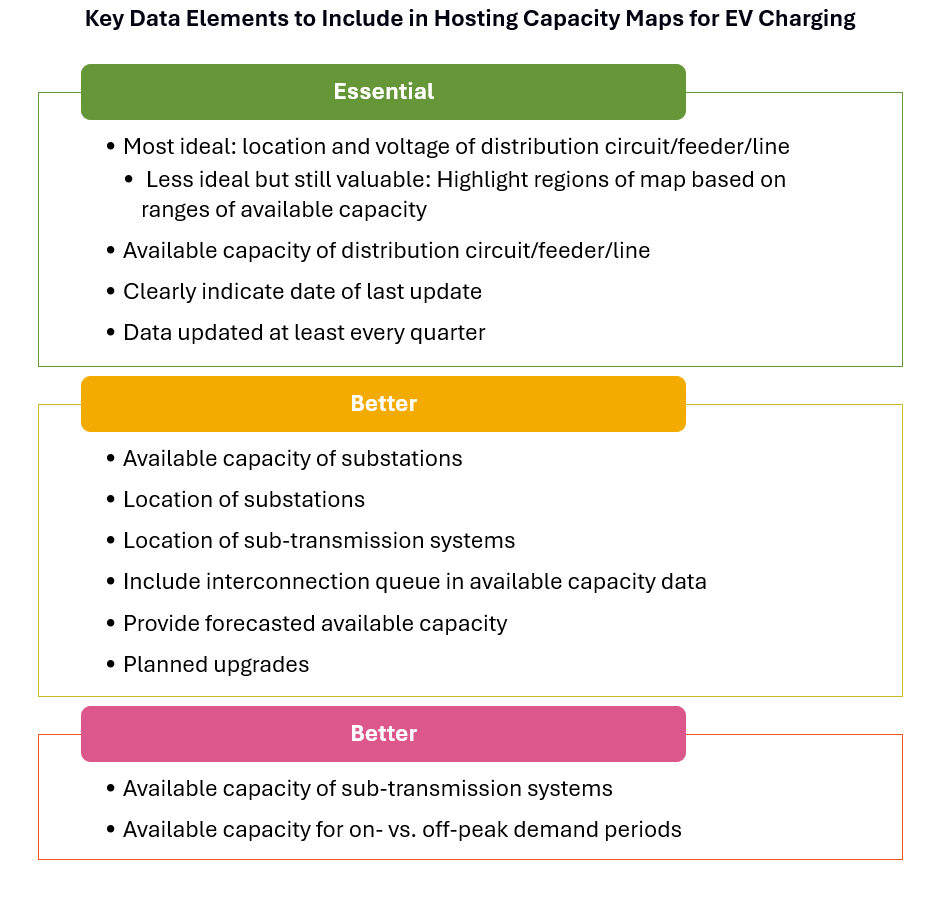
During our interviews with EV charging developers, we asked about what data is most important to see in hosting capacity maps. Based on responses, we categorized various data elements into three groups: “Essential,” “Better,” and “Best.” Below is a summary of each category. (Note: These categories are not meant to replace each other but rather add to each other. In other words, the “best” hosting capacity map would include all data elements listed in the “essential” and “better” categories as well.) Many interviewees emphasized that, while hosting capacity maps vary widely in terms of granularity of data, a map that provides even just the minimum essential data and is updated regularly with correct data can be extremely useful and is much preferred to no map at all.
“Essential” to have: Developers emphasized the need for basic yet critical information. Several developers identified location, voltage, and available capacity of distribution circuits/feeders/lines as essential. Notably, some utilities do not show individual distribution circuits/feeders/lines and instead color-code regions of the map to indicate a range of available capacity. Three of the utilities interviewed provide this kind of map. While EV charging developers said they would prefer to see individual circuits, maps that show ranges of available capacity can still be valuable and preferable to no map at all. The Los Angeles Department of Water and Power’s (LADWP) map is a good example of how valuable these “essential” data points can be: while LADWP’s map only meets these minimum criteria, two EV charging developers mentioned it when asked for examples of good hosting capacity maps. Additionally, developers noted the importance of regular updates—preferably quarterly—and clear timestamps showing the most recent updates.
“Better” to have: Beyond the essentials, developers identified data that could significantly enhance a map’s value. This includes substation locations and available capacity, which makes Southern California Edison’s (SCE) hosting capacity map a standout example. Other desirable features include data on planned grid upgrades, forecasts of future capacity, and information on interconnection queues.
“Best” to have: To make hosting capacity maps as useful as possible, developers suggested incorporating sub-transmission-level data. They noted experiences with hosting capacity maps where an area appeared to have sufficient hosting capacity for a charging project based on a map, but sub-transmission constraints discovered during a load study revealed that costly and lengthy upgrades would be required to develop the project. Including this data would help developers avoid such surprises.
The research also explored challenges utilities face in developing hosting capacity maps. A key concern among utilities is security. Several utilities expressed concern that making detailed information about utility assets public could expose the grid to risks of cyber or physical attacks. Additionally, resource availability can vary widely among utilities. For instance, while hosting capacity maps aim to reduce developer requests for load studies, creating and maintaining these maps also requires staff time and resources. Moreover, some utilities may lack specialized resources, such as a geographic information system (GIS) team, and using third parties can be costly.
Although there are challenges, hosting capacity maps can help charging developers improve project timelines and reduce costs and help utilities better utilize their existing grids thereby reducing upgrade needs and associated costs.
View the report here.

