Source: EValuateNY
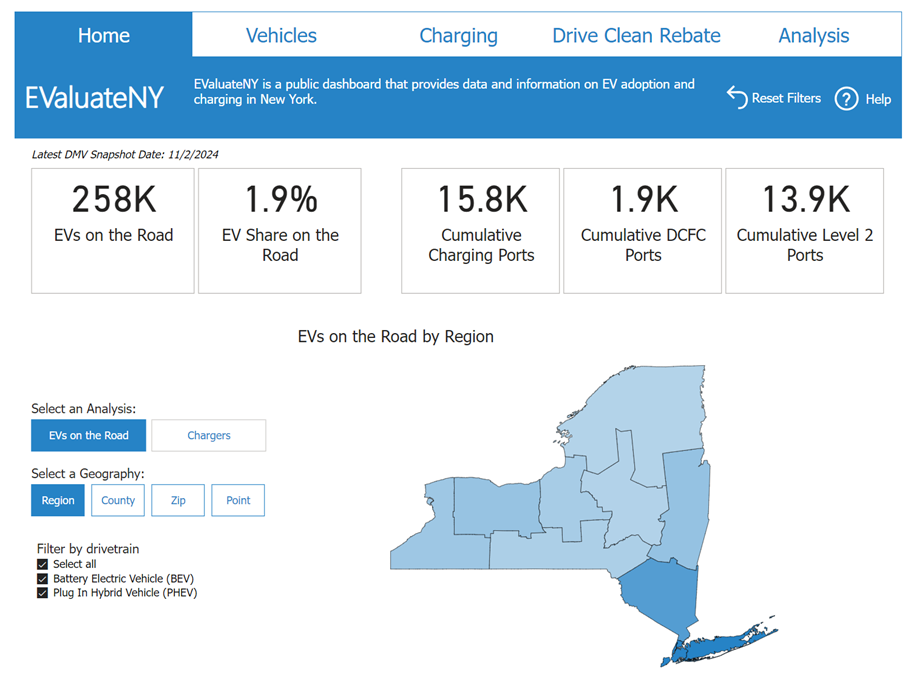
Last week, we introduced several updates to the EValuateNY Dashboard, an interactive tool that consolidates and presents data on New York’s electric vehicle (EV) market. The dashboard integrates multiple data categories related to EVs, with most underlying datasets refreshed weekly and vehicle registration data refreshed monthly to ensure users have access to the most current information available.
For context, EValuate is a collaborative initiative between Atlas Public Policy and several state governments aimed at improving access to vehicle registration data and related insights into the EV market. Launched in 2015, EValuateNY became the flagship product of this effort, demonstrating the potential of data-driven tools to inform public policy and decision-making in the transportation electrification sector.
The EValuate initiative underscores the importance of data in evaluating the effectiveness of EV policies and programs. It brings together several categories of information about the EV market and empowers users to derive insights and create compelling visuals with ease. The redesigned EValuateNY Dashboard, supported by the New York State Energy Research and Development Authority (NYSERDA), enhances the user experience with a streamlined interface and introduces a new analysis page for comparing EV market and charging data across different regions of New York State.
This interactive dashboard provides comprehensive data on the EV market in New York, including the “Vehicles” page. This page offers a detailed view of EV deployment, including data on location, make, model, year, class, and type. Users can analyze EV adoption by region, county, zip code, and even by utility. Additionally, the page highlights trends in EV growth and shows the top-selling models in the state.
Next, the “Charging” page visualizes New York’s public charging infrastructure, including station locations, power levels, connector types, and charging networks. The data can be filtered by region and includes insights into the top five networks based on Level 2 and DC fast-charging port counts, offering a clear picture of the charging landscape across the state.
The dashboard also evaluates the impact of New York’s Drive Clean Rebate Program, launched in 2017. This section tracks the number of rebates issued, total funding disbursed, and remaining program funds. Users can filter rebate information by region, county, and zip code, as well as view rebate amounts by vehicle make and model. Additionally, a timeline feature displays the disbursement of rebate funding over time, offering a comprehensive view of the program’s progress.
Finally, a critical addition to the updated dashboard is the “Analysis” page, which allows users to conduct custom regional comparisons. For example, someone interested in examining differences between the EV markets in New York City and Long Island can access detailed breakdowns of vehicle and charging data, as well as demographic information, for these regions.
We offer similar EValuate dashboards for several other states, including New Jersey, Vermont, North Carolina, Maine, Colorado, Minnesota, Virginia, New Mexico, Connecticut, and Oregon, through there are differences in scope and granularity of data. More information on our effort to make available state vehicle registration data can be found on EV Hub here.


